Data is a valuable asset. Companies rely on data analytics tools to turn raw data into useful insights. These tools help improve decision-making, optimize processes, and gain a competitive edge. Choosing the right data analytics tools can be challenging with many options available. In this article, we’ll explore essential data analytics tools every data analyst should consider, no matter the size or industry.
Data Analytics Tools Your Business Should Be Using
Below are data analytics tool you should consider for your business:
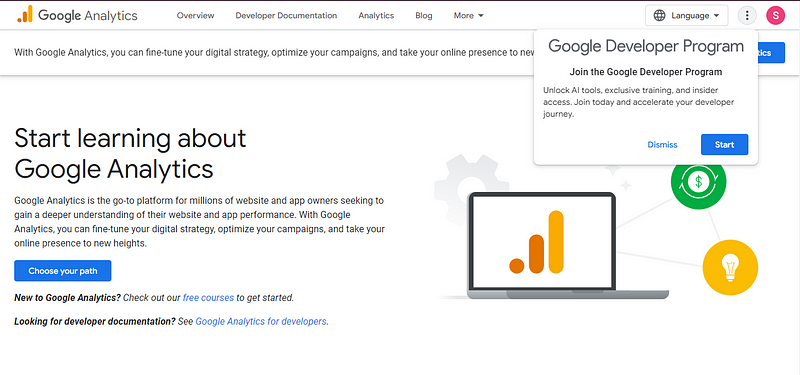
Google Analytics
Google Analytics tracks website traffic and user behavior. It shows how visitors interact with a site and which marketing strategies work. It’s a key data analytics tool for improving digital presence. Businesses use it to make data-driven decisions and boost performance.
Key Features:
– Real-time tracking
– Audience segmentation
– Conversion rate analysis
– Integration with Google Ads for advanced marketing insights
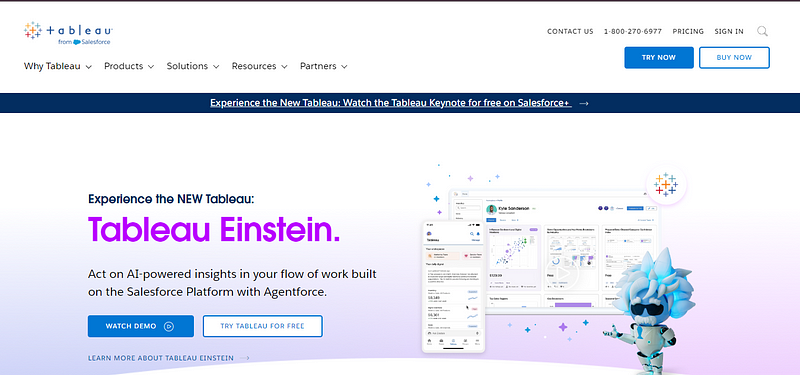
Tableau
Tableau is a data analytics tool for analyzing and visualizing data. It helps businesses create graphs, charts, and dashboards. This tool makes complex data easier to understand and use for decision-making. For those without technical skills, Tableau makes turning raw data into useful insights easy.
Key Features:
– Drag-and-drop interface for creating visuals
– Real-time data analysis
– Connection to multiple data sources like Excel, SQL, and cloud platforms
– Interactive dashboards and reports
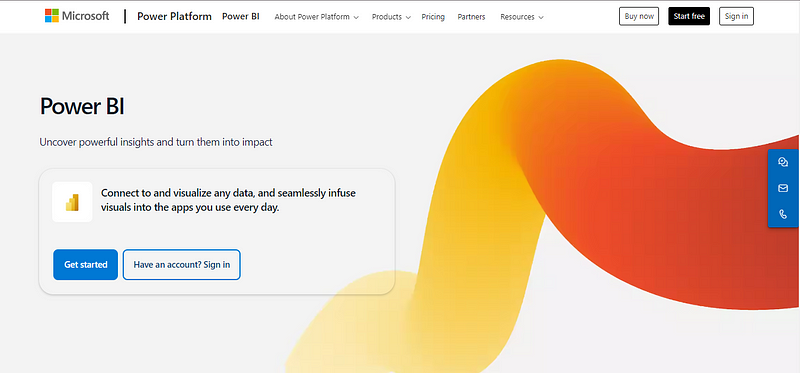
Microsoft Power BI
Microsoft Power BI is a data analytics tool for visualization and business intelligence. It connects to various data sources and provides insights. Teams can easily share these insights. It works well with Microsoft services and helps with collaboration.
Key Features:
– Customizable dashboards
– Integration with Microsoft products like Excel and Azure
– AI-powered data insights
– Real-time data monitoring
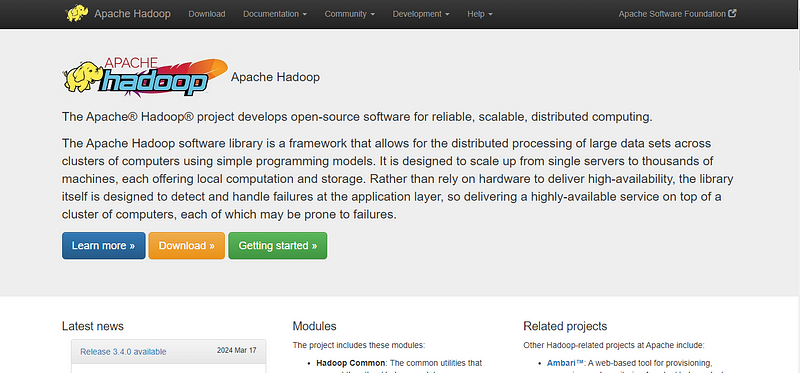
Apache Hadoop
Apache Hadoop is an open-source data analytics tool for processing large datasets. It works in a distributed computing environment. Hadoop is great for businesses with huge amounts of structured and unstructured data. Its ability to handle massive datasets makes it one of the top data analytics tools for businesses managing big data.
Key Features:
– Scalability for processing big data
– Ability to handle data from multiple sources
– Integration with other big data tools like Apache Spark
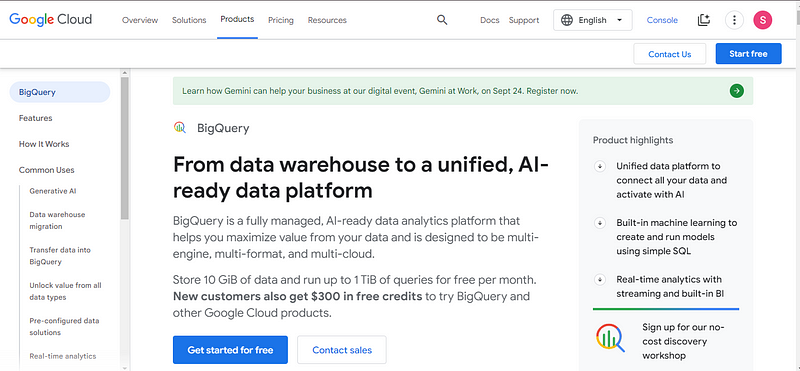
Google BigQuery
Google BigQuery is a cloud-based data analytics tool. It analyzes large datasets quickly with real-time analytics. It doesn’t require complex infrastructure and scales easily. It’s ideal for businesses needing fast insights without extensive setup.
Key Features
– Scalable for big data queries
– Real-time analysis and machine learning integration
– Secure, cloud-based architecture
– Easy integration with other Google Cloud services
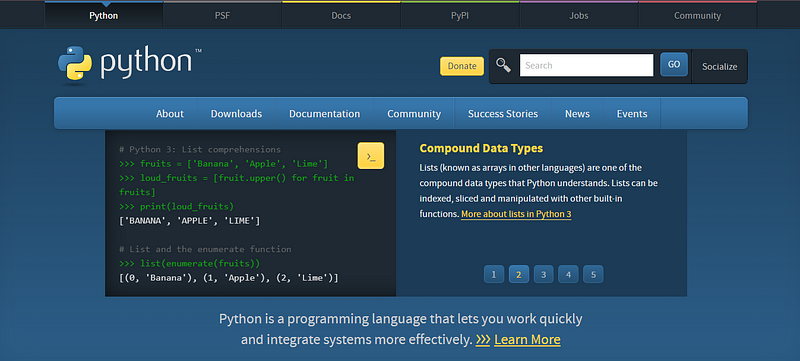
R and Python
R and Python are popular programming languages for data analytics. They have many libraries for data manipulation, visualization, and statistics. For businesses, R and Python offer flexible and customizable data analytics tools. They can handle everything from basic data tasks to advanced machine learning.
Key Features:
– Flexibility for custom data analysis
– Rich ecosystem of libraries (e.g., Pandas, NumPy for Python, ggplot2 for R)
– Suitable for machine learning and advanced analytics
Splunk
Splunk is a data analytics tool for machine data, like logs from servers and networks. It helps IT teams monitor system performance and security. For businesses with lots of IT infrastructure, Splunk is crucial. It ensures system uptime, security, and performance.
Key Features
– Real-time data collection and analysis
– Log management and monitoring
– AI-powered machine learning tools
– Scalable for big data environments
Qlik Sense
Qlik Sense is a data analytics tool that helps with data exploration and visualization. It allows users to create interactive reports and dashboards.
Key Features
– Intuitive Interface: Easy to use with drag-and-drop functionality.
– Data Discovery: Quickly explore and analyze data with self-service tools.
– Interactive Dashboards: Create customizable and interactive dashboards.
– Data Integration: Connects to various data sources for a unified view.
– Smart Search: Use natural language to search and find data insights.
Microsoft Excel
Microsoft Excel is a simple tool for organizing, analyzing, and visualizing data. It works with different types of data and helps find insights. Teams use Excel for reporting and sharing data easily. It integrates well with other Microsoft services.
Key Features:
– Customizable formulas and functions
– Works with Power BI and SharePoint
– Pivot tables for quick analysis
– Easy-to-create charts and graphs
SQL (Structured Query Language)
SQL is a tool for managing and querying data in databases. It helps you retrieve, update, and manipulate data. Teams use SQL to work with large datasets and create reports. SQL works with many databases.
Key Features:
– Fast querying of large datasets
– Connects to databases like MySQL and PostgreSQL
– Helps manage and extract data
– Retrieves data in real time
How to Choose the Right Data Analytics Tool
Selecting the right data analytics tool is crucial for effective data analysis and decision-making.
Assess Your Business Needs
To begin, assess your business needs to identify the features and capabilities required from a data analytics tool. Consider whether you need robust data visualization, real-time analysis, or advanced reporting features. Understanding how the tool will be integrated into your business processes and addressing specific use cases is key.
Evaluate Tool Features & Consider Scalability
Evaluate the features of potential data analytics tools. Look for those that offer strong data visualization options, seamless integration with your existing systems and data sources, and a user-friendly interface that matches your team’s skill level. Scalability is also important; choose a data analytics tool that can grow with your business and efficiently handle increasing volumes of data.
Assess Cost and Value
When looking at cost, compare the prices of different data analytics tools. Check their features and benefits. Consider how much value they offer based on their efficiency and insights. This helps you see the potential return on investment.
Test the Tool
Use free trials to gauge its functionality and suitability for your needs. Also, review product demos and user feedback to understand its real-world performance and effectiveness.
Support and Training
Make sure the data analytics tool has good customer support and training resources. Support helps with troubleshooting. Training materials help your team use the tool effectively.
Check these factors to pick a tool that fits your needs, works with your systems, and provides useful insights for decisions.
Wrapping Up
Choosing the right data analytics tools can improve your business decisions and growth. Tools like Microsoft Power BI, Tableau, R, Python, Qlik Sense, and Splunk have different features for various needs. Choose the tool that fits your business to improve data analysis and teamwork.
As data grows in importance, investing in the right tools is key to success. Want to learn about these tools? Take the step and register with Figureshub today!